Learning Hub
 Sign up to our newsletter
28 March 2023
Justine Patterson - Senior Population Health Strategy Executive in International Consulting at Oracle – blogs on how Lewisham’s population health platform used the Vital 5 to reduce health inequalities.
Standardising the approach
The Vital 5 initiative, championed by King’s Health Partners, is a key component of South East London (SEL) Integrated Care System’s (ICS) long term strategy to improve their population health outcomes.
The Vital 5 refers to five risk factors that have a major impact on health at an individual and population level, and by focusing on measuring them as standard, and then on controlling them, people can live healthier, longer lives whilst also reducing health inequalities across the population.
These factors are not just a local concern – for the UK, 40% of disability-adjusted life years lost are attributable to smoking, alcohol consumption, hypertension and obesity.
The Vital 5 are:
- Blood pressure
Reduce stroke and heart attack, and improve wellbeing (measured through BP recording)
- Obesity
Reduce diabetes, renal dialysis, liver transplants, amputations and other comorbidities, and improve wellbeing (measured through Body Mass Index [BMI] from height/weight recording)
- Mental health
Reduce the incidence, burden and recurrence of mental illness, and promote wellbeing as a protective factor against illness (measured through Generalised Anxiety Disorder Assessment [GAD-7] and/or Patient Health Questionnaire [PHQ-9] depression module)
- Smoking status
Reduce respiratory and malignant disease, and improve wellbeing (measured through volume and frequency questionnaire)
- Alcohol intake
Reduce liver transplants and malignant disease, and improve wellbeing (measured through volume and frequency questionnaire)
The principles of the Vital 5 will help prevent ill health, promote good health, and improve detection, management and treatment of existing conditions.
Identifying, recording, and sharing the Vital 5 measures between all health professionals and residents – and acting on the results across the population – would substantially improve outcomes and support the longer-term sustainability of the health and care system.
Initial analysis
After an initial pilot in Southwark, King’s Health Partners (KHP) approached Lewisham Health and Care Partners to conduct an initial Vital 5 audit, followed by a deep dive into blood pressure, using the integrated dataset within Lewisham’s population health platform, Oracle Health’s HealtheIntent. This dataset contains near real-time, person-level linked data from primary care, secondary care, community, and mental health services data sources
Acting chief strategy, partnerships and transformation officer at Lewisham and Greenwich NHS Trust, Sandra Iskander, explains:
“We have so much data and we can cut it in so many ways, you can very quickly get lost in it. The work we did in hypertension we did with our local academic health sciences centre, King's Health Partners, and they brought a really valuable academic rigour to the question: who are the people with hypertension that we are not supporting to manage their condition, and can we get that to a prioritised list of those that we think we can act on?”
This process involved analysing the linked data to understand prevalence, identify people who are at risk of high blood pressure (and not on a hypertension register), and identify risk among those with known hypertension. The results of the joint analysis have helped inform further work in Lewisham to tackle health inequalities and the methodology has been shared with other boroughs in SEL ICS to inform their work.
The aims of the initial analysis included:
- Assessing and understanding the recorded prevalence in Lewisham for the Vital 5 and establishing the baseline of the Lewisham population;
- Segmenting those with Vital 5 recordings by severity, e.g. very obese or heavy drinkers (where applicable), and by inequalities (deprivation, ethnicity) and demographics (age, gender) or other factors, such as long-term conditions, social care clients or frailty scores to understand more about the population;
- Understanding the population in Lewisham who have no Vital 5 data recorded and any trends relating to that, such as ethnicity or deprivation.
For the purposes of this analysis, the registered Lewisham population was 328,144 (excluding deceased and opt-outs) in May 2022.
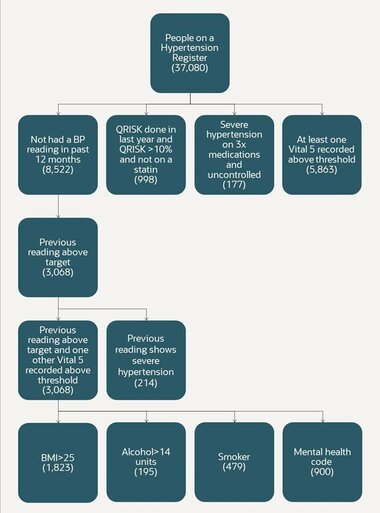
People on a hypertension register
Primary care IT systems have disease or condition based QOF registers for people with known diagnoses. The in-depth analysis of people already on a hypertension register showed:
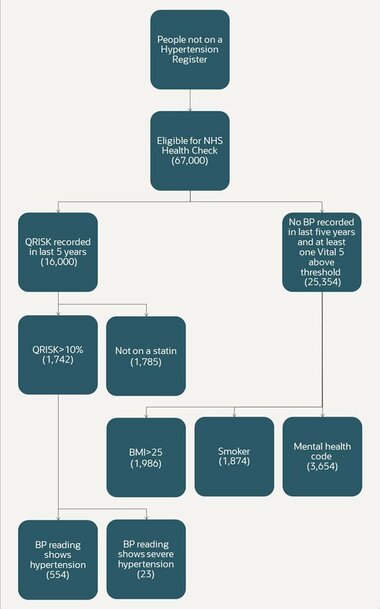
People not on a hypertension register
For people not on a hypertension register the analysis showed:
Severe hypertension
The analysis also revealed that 521 people in Lewisham had severe hypertension (≥180 systolic and/or ≥120 diastolic) based on their latest recorded reading within the last five years. Of those, 278 people (53%) had readings taken in the last year.
Missing Vital 5 data
For those without any Vital 5 recordings in the last five years, data was analysed to investigate their characteristics to understand if this cohort was different from a potential inequalities perspective. There were considerable inequalities in the recording of Vital 5 measures across a range of socioeconomic and demographic groups:
- Males had significantly lower levels of recording across all measures compared to females;
- Mental health was recorded at a significantly lower level than all other metrics;
- Smoking status is the indicator that is recorded in the most records – 63% of all records have a record of smoking status in the last five years;
- The recording of measurements is poorest in those from mixed or multiple ethnic groups for every indicator except mental health, where the recording is poorest in those from the Asian ethnic groups;
- Younger people are much less likely to have a recording of any of the indicators than older age groups.
Overall, the difference in the recording of Vital 5 measurements between the most deprived and least deprived populations is relatively small across all the Vital 5. Results were presented to local groups working to tackle health inequalities in Lewisham who can use the data for local impact, as well as to the SEL-KHP Prevention/Health Inequalities Working Group.
Creating the Vital 5 dashboard
A Vital 5 dashboard developed by the Lewisham population health and care analytics team provides various health inequalities views at place, primary care network (PCN), and individual practice levels through the use of various filters. This intelligence helps inform interventions at each level, while filtering it helps people to work more effectively by only presenting the data that they need.
Dharmendra Naidu, health insights and analytics lead at One Health Lewisham (the GP Federation), explains the impact of streamlining data for analysis and developing the dashboard, “We were able to leverage the groundwork that Oracle Health colleagues had already done around concept curation6 in the population health platform. Codes coming from various data sources can be pulled with a single line of code rather than adding hundreds of codes – it made my job much easier and quicker!”
The integrated data can also be visualised in different views including ethnicity, Lower Layer Super Output Areas (LSOA), and disease severity. This can be represented visually on a map, such as this one below, which shows people on the hypertension register with no QRISK score in the last year, and with their most recent BP reading showing them to be in the range of severe hypertension.
Figure above: People on BP register but no QRISK score in the last year where latest BP reading is in the range of severe hypertension (Black African/Caribbean population)
Integrating Core20PLUS5
The Core20PLUS5 approach has been developed by NHS England to address and reduce health inequalities at national and system level. A few months after the initial ‘deep dive’ analysis, Lewisham applied its Core20PLUS5 filters to the Vital 5 data to look for any correlations and highlight inequalities.
Hypertension diagnosis/on a hypertension register is 37,266 of which:
- Core20: 9,890;
- PLUS-Ethnicity: 13,984;
- PLUS-Vulnerable: 1,683;
- Total: 25,557.
This analysis shows that 69% (25,557) of people already on a hypertension register also fall into Lewisham’s Core20PLUS5 cohort. 27% (10,260) of those on the register and in Core20PLUS5 segment either have uncontrolled blood pressure (assessed from their latest BP reading) or no BP reading recorded in the last five years.
Lewisham will have the capability to segment and prioritise the Vital 5 cohorts by the Core20PLUS5 filters in a new analytics tool, which is currently in development, in order to provide actionable insight. This will identify individuals within the cohorts so that integrated frontline teams can proactively implement interventions. The focus for hypertension is to optimise blood pressure and minimise the risk of cardiovascular disease events, such as heart attacks and strokes.
From data to community-based impact
This work is ongoing and being sponsored locally by the health inequalities primary care clinical director at Lewisham. Work is under way to determine how best to take forward work on prevalence of Vital 5, high-risk cohorts, and agreeing action groups – initially focusing on hypertension. Public Health colleagues have recommended that this data be consolidated within PCN and practice profile packs, so that the next steps could be determined locally by each PCN with input from their newly appointed Health Inequalities Fellows, who have a responsibility to work closely with community groups to codesign interventions in different areas such hypertension management.
There are a number of use cases for these profile packs across the boroughs, not least to facilitate place-based discussions between service providers, commissioners, and local community-based organisations to engage with local populations and help determine the most appropriate interventions. Building connections with community groups through shared data will also help to take forward recommended actions, e.g. facilitate the codesign and evaluation of interventions that would be culturally appropriate, with an emphasis on creating new routes to accessing traditional care models.
To help determine appropriate interventions at PCN level, person identifiers are also being included in the data to support cohort identification of high-risk populations.
The hard work and determination to produce this targeted, integrated data set has already proven its worth, as Sandra Iskander concludes: “It’s still early days, but we’re confident that this is giving us a new approach to addressing some quite long-standing problems, and the other benefit is that we can use the data and the analytical tools to help us evaluate impact so that we can continue to tweak and adjust as we go along."
Read more about the Vital 5 and Value Based Healthcare on the King's Health Partners website.
Further detail on sources can be found in footnotes on the original article here. Any questions or comments relating to the dashboard can be directed to lg.pophealthlewisham@nhs.net.